Chapter 3 Probability
- The sample space is the set of all possible outcomes.
- an event is any set of outcomes of interest.
- The probability of an event is the relative frequency of this set of outcomes over an indefinitely large (or infinite) number of trials.
Let = symptom and = disease. A symptom or a set of symptoms can also be regarded as a screening test for disease (positive or negative for a symptom case).
Example:
- = family history (positive if present), = breast cancer.
- = smoking (positive if smoker), = lung cancer.
Explanation: Sample space = , and are two events, where , .
Predictive value (PV)
- predictive value positive (PV+): the probability that a person has a disease given that the test is positive: .
- predictive value negative (PV-): the probability that a person does not have a disease given that the test is negative: .
The higher the PV of the screening test or symptoms, the more valuable the test will be.
Directly measure the PV is difficult, but clinicians can measure how often specific symptoms occur in diseased and normal people, such as sensitivity and specificity defined below.
Sensitivity and Specificity
Sensitivity: The probability of a positive test result among diseased patients: .
Corresponding error: false negative, negative test results for diseased patients. If , false negatives increase, too many false negatives.
Example: 5% of women with breast cancer have a family history of breast cancer. Solution: the sensitivity of a family history of breast cancer as a predictor of breast cancer is .05, too many false negatives.
Specificity: The probability of a negative test result among non-diseased patients: .
Corresponding error: false positive, positive test results for non-diseased patients. If , false positives increase, too many false positives.
Example: 30% of people without lung cancer are smokers. Solution: the specificity of smoking as a screening test for lung cancer are 1 - .3 = .7, too many false positives.
Bayes' Rule
= symptom and = disease.
- Predictive value positive = =
- Predictive value negative = =
- Sensitivity =
- Specificity =
- Probability of disease in the reference population:
Given the above quantities, we can compute and now, the relationship is known as Bayes' rule:
In words:
where prevalence of disease in the reference population. Similarly,
Generalized Bayes' Rule
In clinical medicine there are often more than two possible disease states. We would like to be able to predict the most likely disease state given a specific symptom (or set of symptoms).
Let be a set of mutually exclusive and exhaustive disease states; that is, at least one disease state must occur and no two disease states can occur at the same time. Let represent the presence of a symptom or set of symptoms. Then
ROC curve
Example
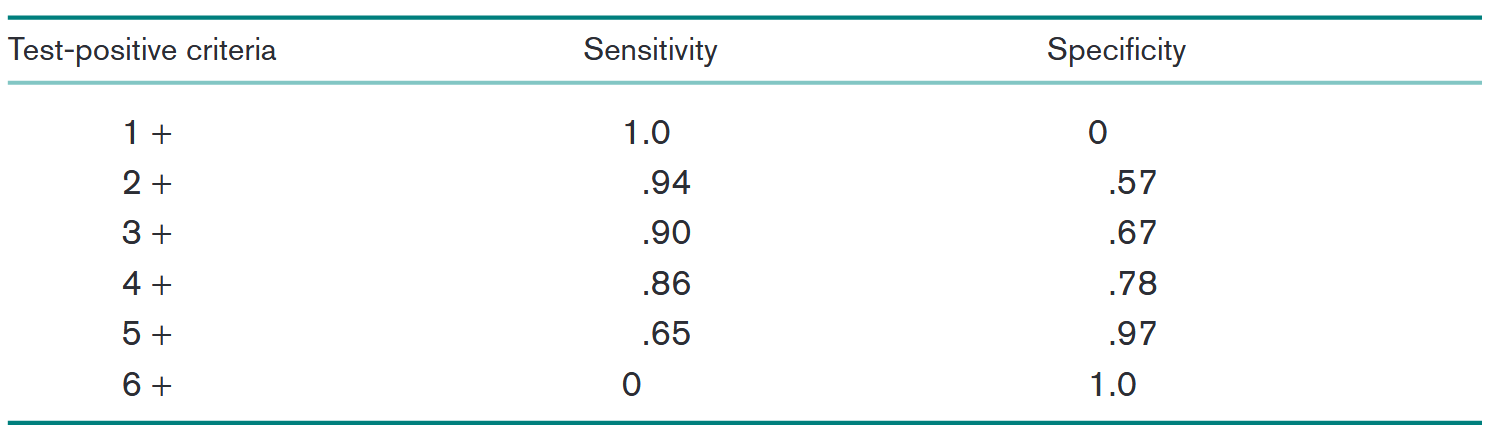
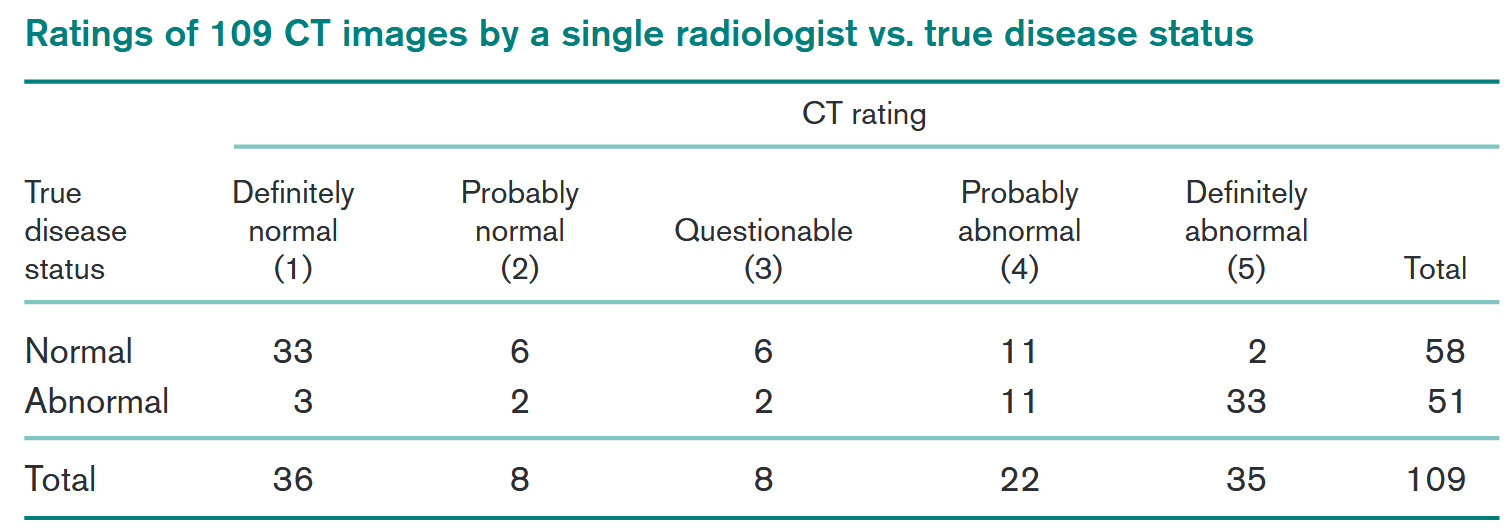 Sensitivity and specificity of the radiologist’s ratings according to different test-positive criteria:
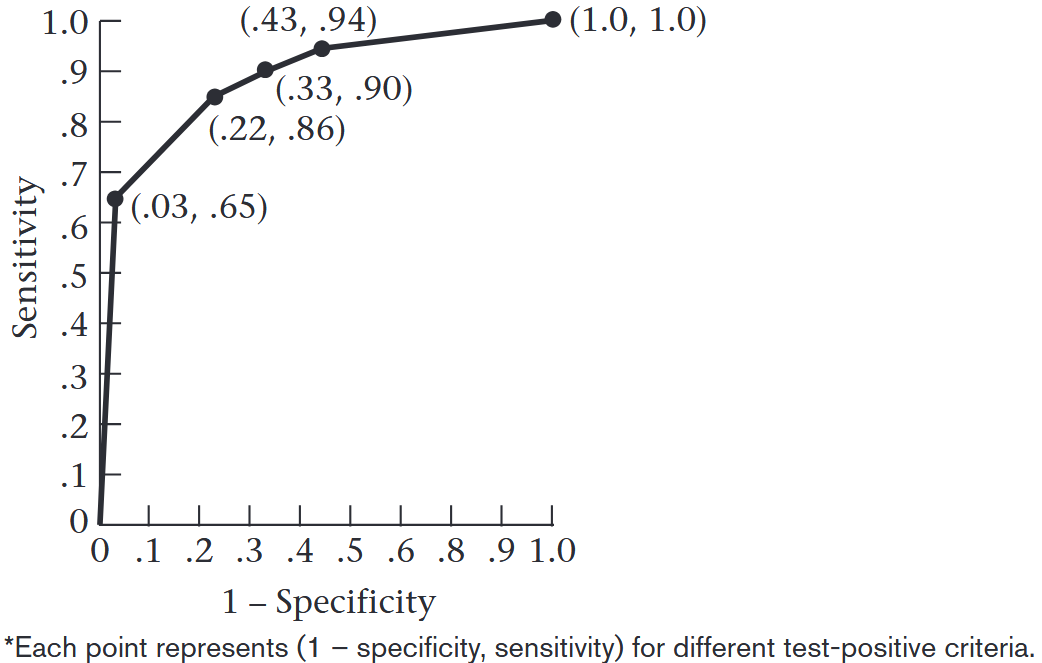
A receiver operating characteristic (ROC) curve is a plot of the sensitivity versus (1 – specificity) of a screening test, where the different points on the curve correspond to different cutoff points used to designate test-positive.
ROC curve for the data
Sensitivity = 1 - Specificity = = waiting for further understanding
Prevalence and Incidence
The prevalence of a disease is the probability of currently having the disease regardless of the duration of time one has had the disease. Prevalence is obtained by dividing the number of people who currently have the disease by the number of people in the study population.
Example Hypertension The prevalence of hypertension among adults (age 17 and older) was reported to be 20.3%, as assessed by the NHANES study conducted in 1999–2000. It was computed by dividing the number of people who had reported taking a prescription for hypertension and were 17 years of age and older (1225) by the total number of people 17 years of age and older in the study population (6044).
The cumulative incidence of a disease is the probability that a person with no prior disease will develop a new case of the disease over some specified time period.
Example Cancer The cumulative-incidence rate of breast cancer in 40- to 44-year-old U.S. women over the time period 2002–2006 was approximately 118.4 per 100,000. This means that on January 1, 2002, about 118 in 100,000 women 40 to 44 years of age who had never had breast cancer would develop breast cancer by December 31, 2002. NOTE: annual rate.